CI (Continuous Integration): analysis, tests, quality, and security
📚 Series: CI/CD and AI: From Theory to Practice
The CI phase is the quality core of the pipeline: here code is compiled, analyzed, tested, and evaluated before reaching production. It covers each CI stage — from linting to security scanning — and the role that AI can play in each one.
Parts of this block:
- Part 1 — General architecture and PR Checks
- Part 2 — CI: analysis, tests, quality, and security ← you are here
Table of Contents
- Linting
- Build / Compilation and artifact packaging
- Static Analysis — deep mode
- Unit Tests
- Integration Tests
- Service Tests / Component Tests
- Coverage (Test Coverage)
- Code Quality Gate
- Security Scan
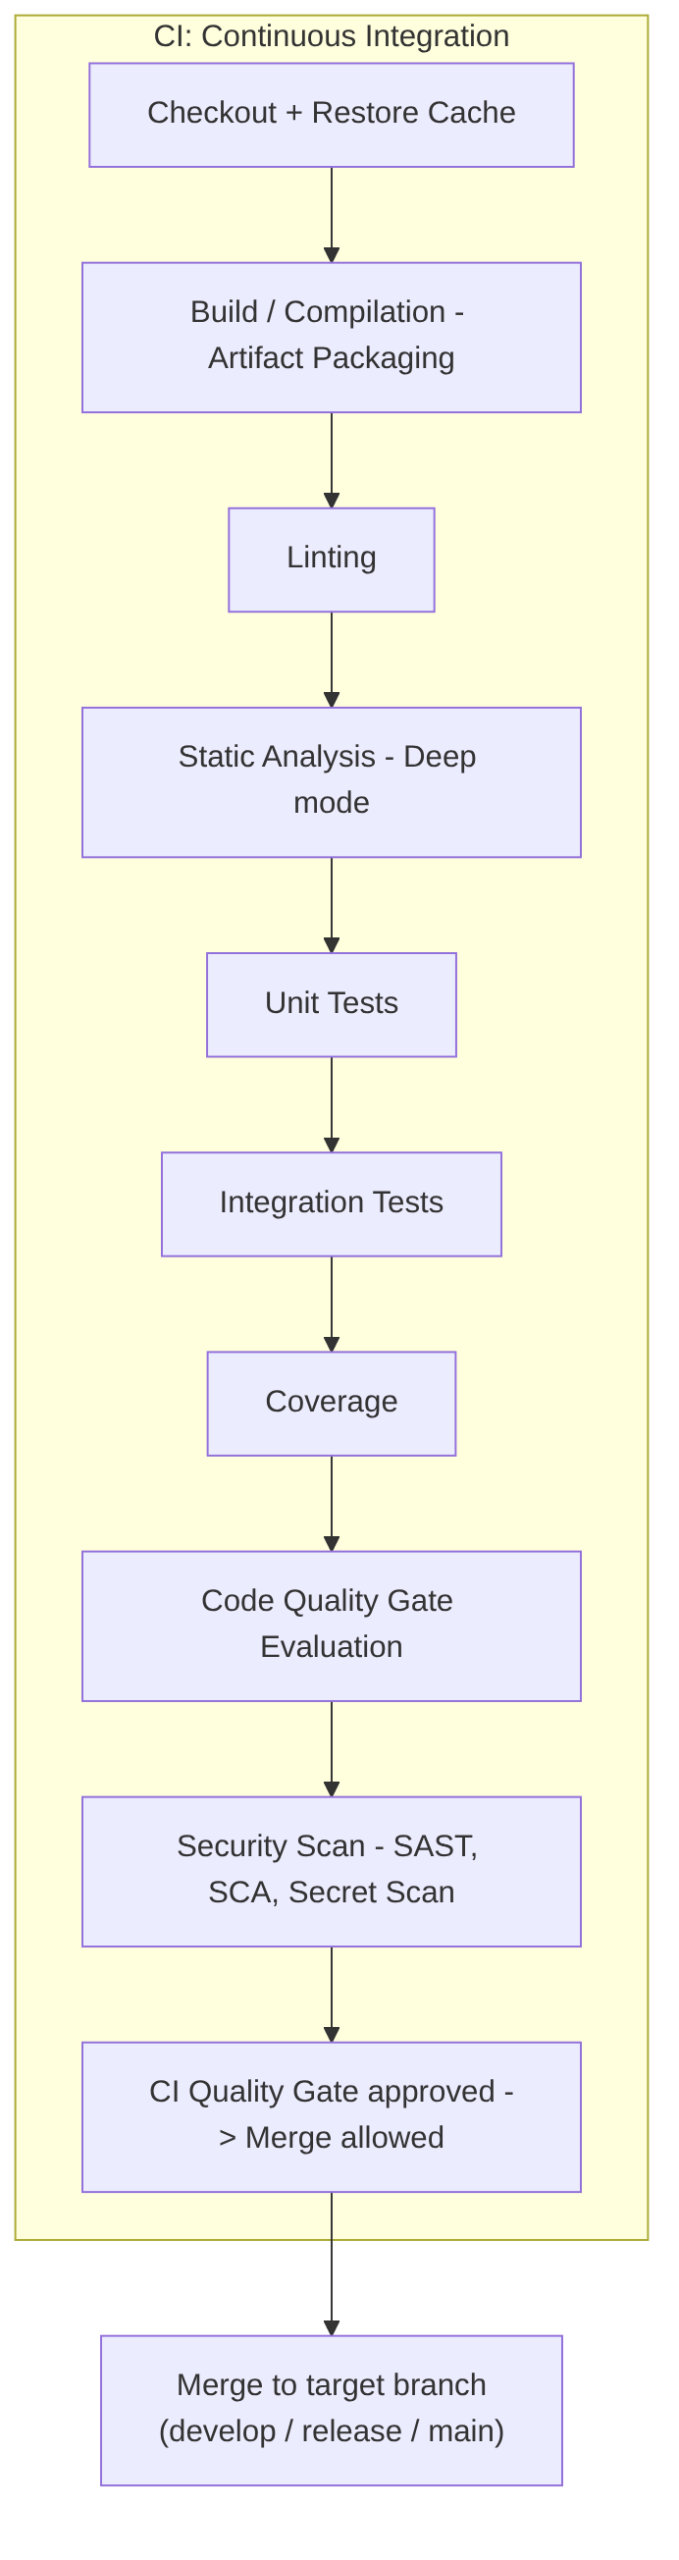
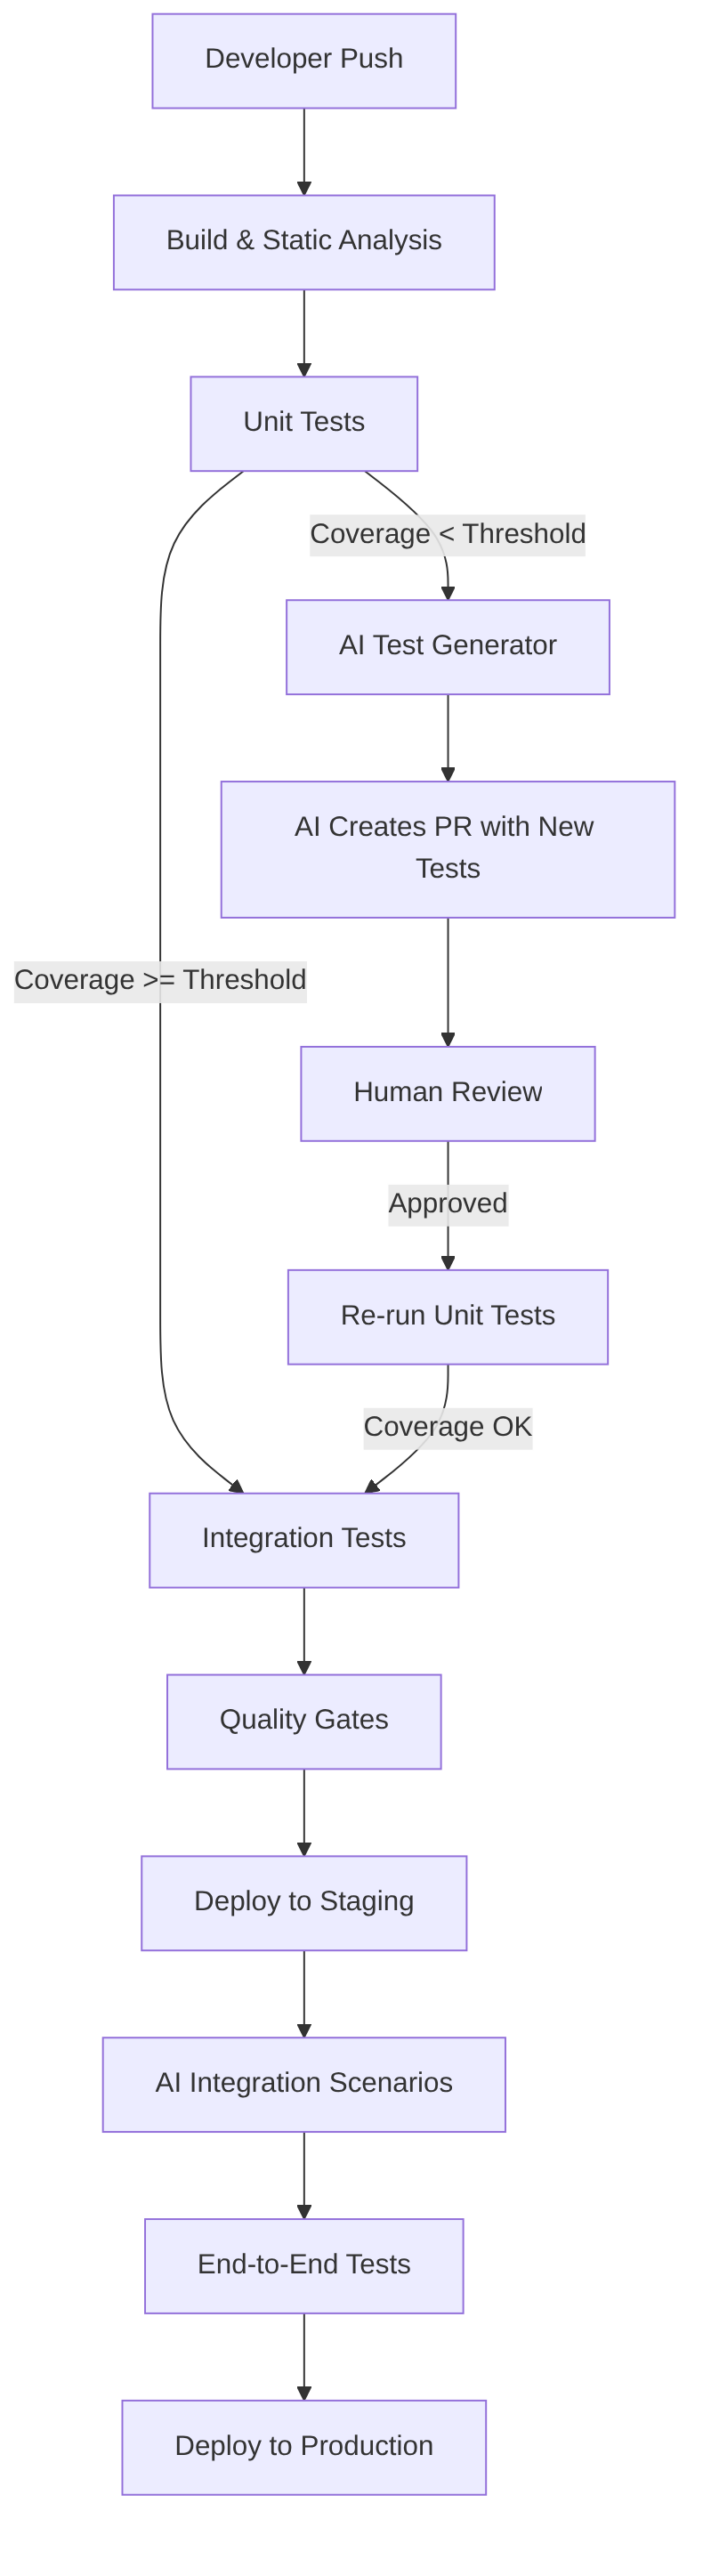
Complete CI diagram
Complete CI architecture we will cover:
Linting
Goal: The linter is the tool that reviews the style, consistency, and formatting rules of the code. It is fast, shallow, and immediate.
What a linter detects
- syntax errors
- unused variables
- unused imports
- incorrect names
- inconsistent style
- incorrect indentation
- spaces, line breaks, quotes
- team style rules
- naming conventions
- basic bad practices
What a linter does NOT detect
- logical errors
- architecture problems
- vulnerabilities
- performance
- duplication
- complexity
- incorrect patterns
Tools by language
| Language | Linter |
|---|---|
| JavaScript / TypeScript | ESLint |
| Python | Flake8, Pylint |
| Java | Checkstyle, SpotBugs (static part) |
| Go | golint, go vet |
| C# | Roslyn Analyzers |
| Terraform | tflint |
| YAML | yamllint |
AI in this phase
AI does NOT replace the linter, because the linter must be:
- objective
- deterministic
- reproducible
- without semantic interpretation
AI is not suited for this because:
- it can be wrong
- it can misinterpret
- it does not guarantee consistency
- it can produce false positives or negatives
But after the linter reports an error, AI can automatically fix the errors detected by the linter.
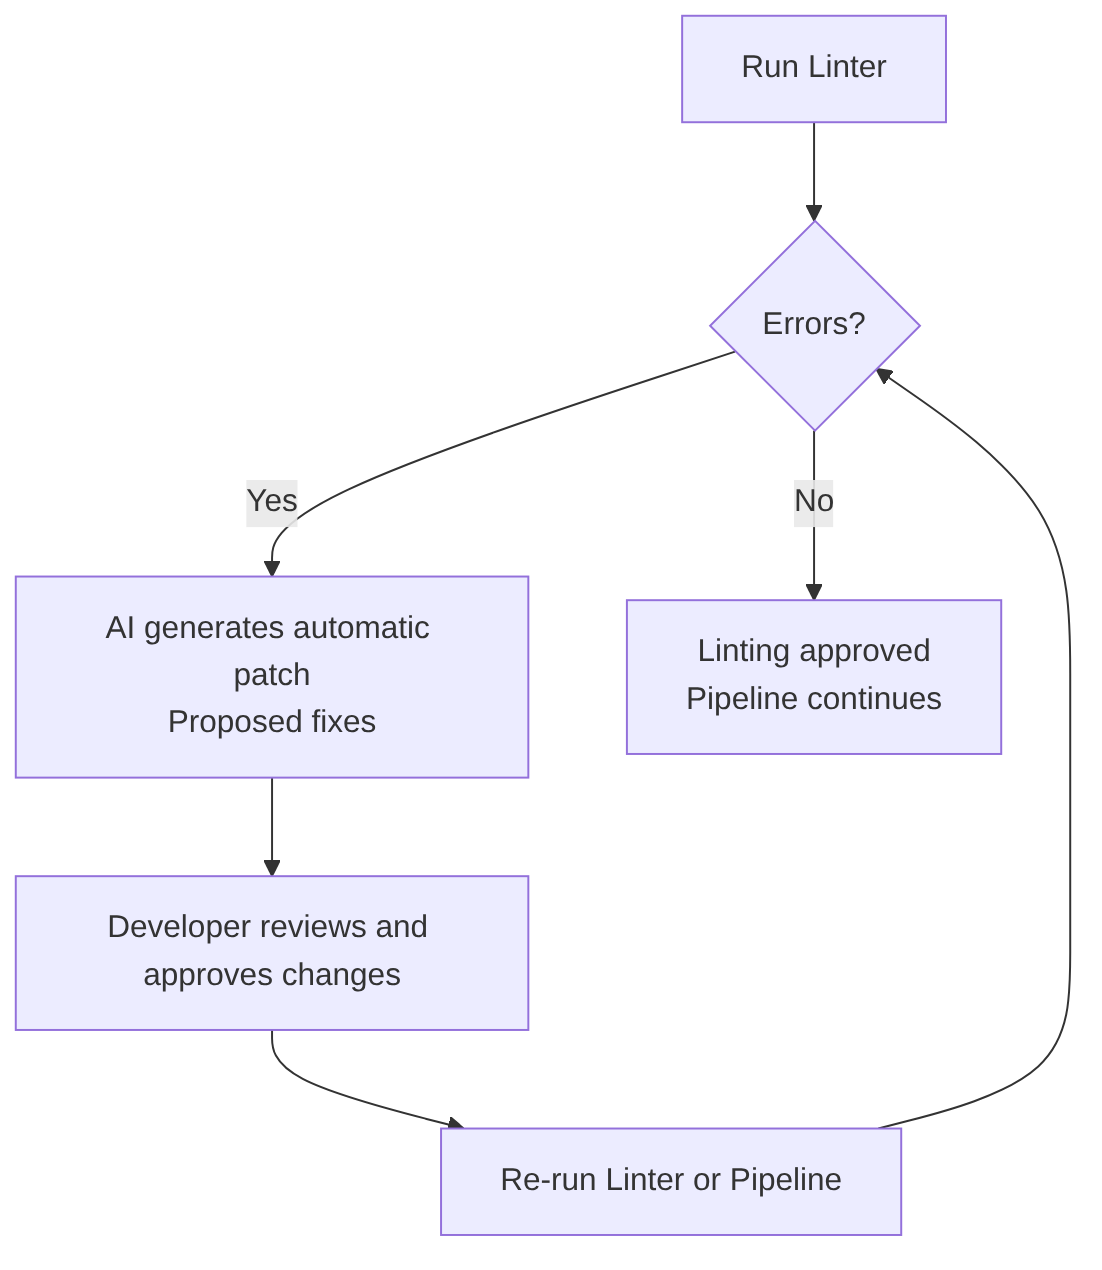
AI can help pass the linter more easily because it:
- detects semantic inconsistencies
- suggests better names
- rewrites code to comply with standards
- auto-corrects linter findings
- explains why a rule is violated
- generates ready-to-apply patches
Build / Compilation and artifact packaging
This code stage belongs to the language or framework that generates artifacts.
Result: an artifact ready to package.
If the language generates artifacts (like Spring Boot compiling to JAR or WAR), this stage is often called Artifact Packaging. For languages that do not generate artifacts (such as Python), this stage is usually skipped.
What it produces
Here:
- compilation
- packaging
- minification
- artifact generation (JAR, WAR, DLL, binaries, dist/)
Examples:
mvn package(Java) maven package documentationgradle buildgradle build documentationnpm run build(Node.js) npm run documentationdotnet builddotnet build documentationgo buildgo build documentationcargo build(Rust) cargo build documentation
Docker multi-stage and when to separate the build from packaging
Can the “Compilation / Build” and “Packaging into an image” stages be unified? Although the future “packaging into an image” stage also performs a build, it is recommended to build outside the image first, especially when:
- using CI system build caches (the build is cached on the runner, not in Docker)
- wanting artifact scanning before packaging
- needing to reuse the artifact in other jobs
- publishing the artifact to Nexus/Artifactory
- running monorepo pipelines
- using SonarQube in “full scan” mode (Sonar analyzes the code before the Docker build)
- wanting to separate responsibilities (build (dev) ≠ packaging (ops))
- Less coupling since the Dockerfile does not need Maven
- Improved audit or compliance
AI in this phase
This stage is a deterministic language process and AI contributes nothing.
Static Analysis — deep mode
Goal: Static analysis is much deeper and slower than linting (which is why it is recommended to run afterward). It analyzes code without executing it, but with semantic, flow, and architecture knowledge.
What static analysis detects
- vulnerabilities (SAST)
- insecure dependencies (SCA)
- code duplication
- cyclomatic complexity
- functions that are too long
- classes that are too large
- incorrect patterns
- architecture violations
- dead code
- potential errors
- null pointer risks
- SQL injection patterns
- XSS patterns
- insecure critical paths
What it does NOT detect
- business logic errors
- problems that only appear at runtime
- integration failures
- complex concurrency issues
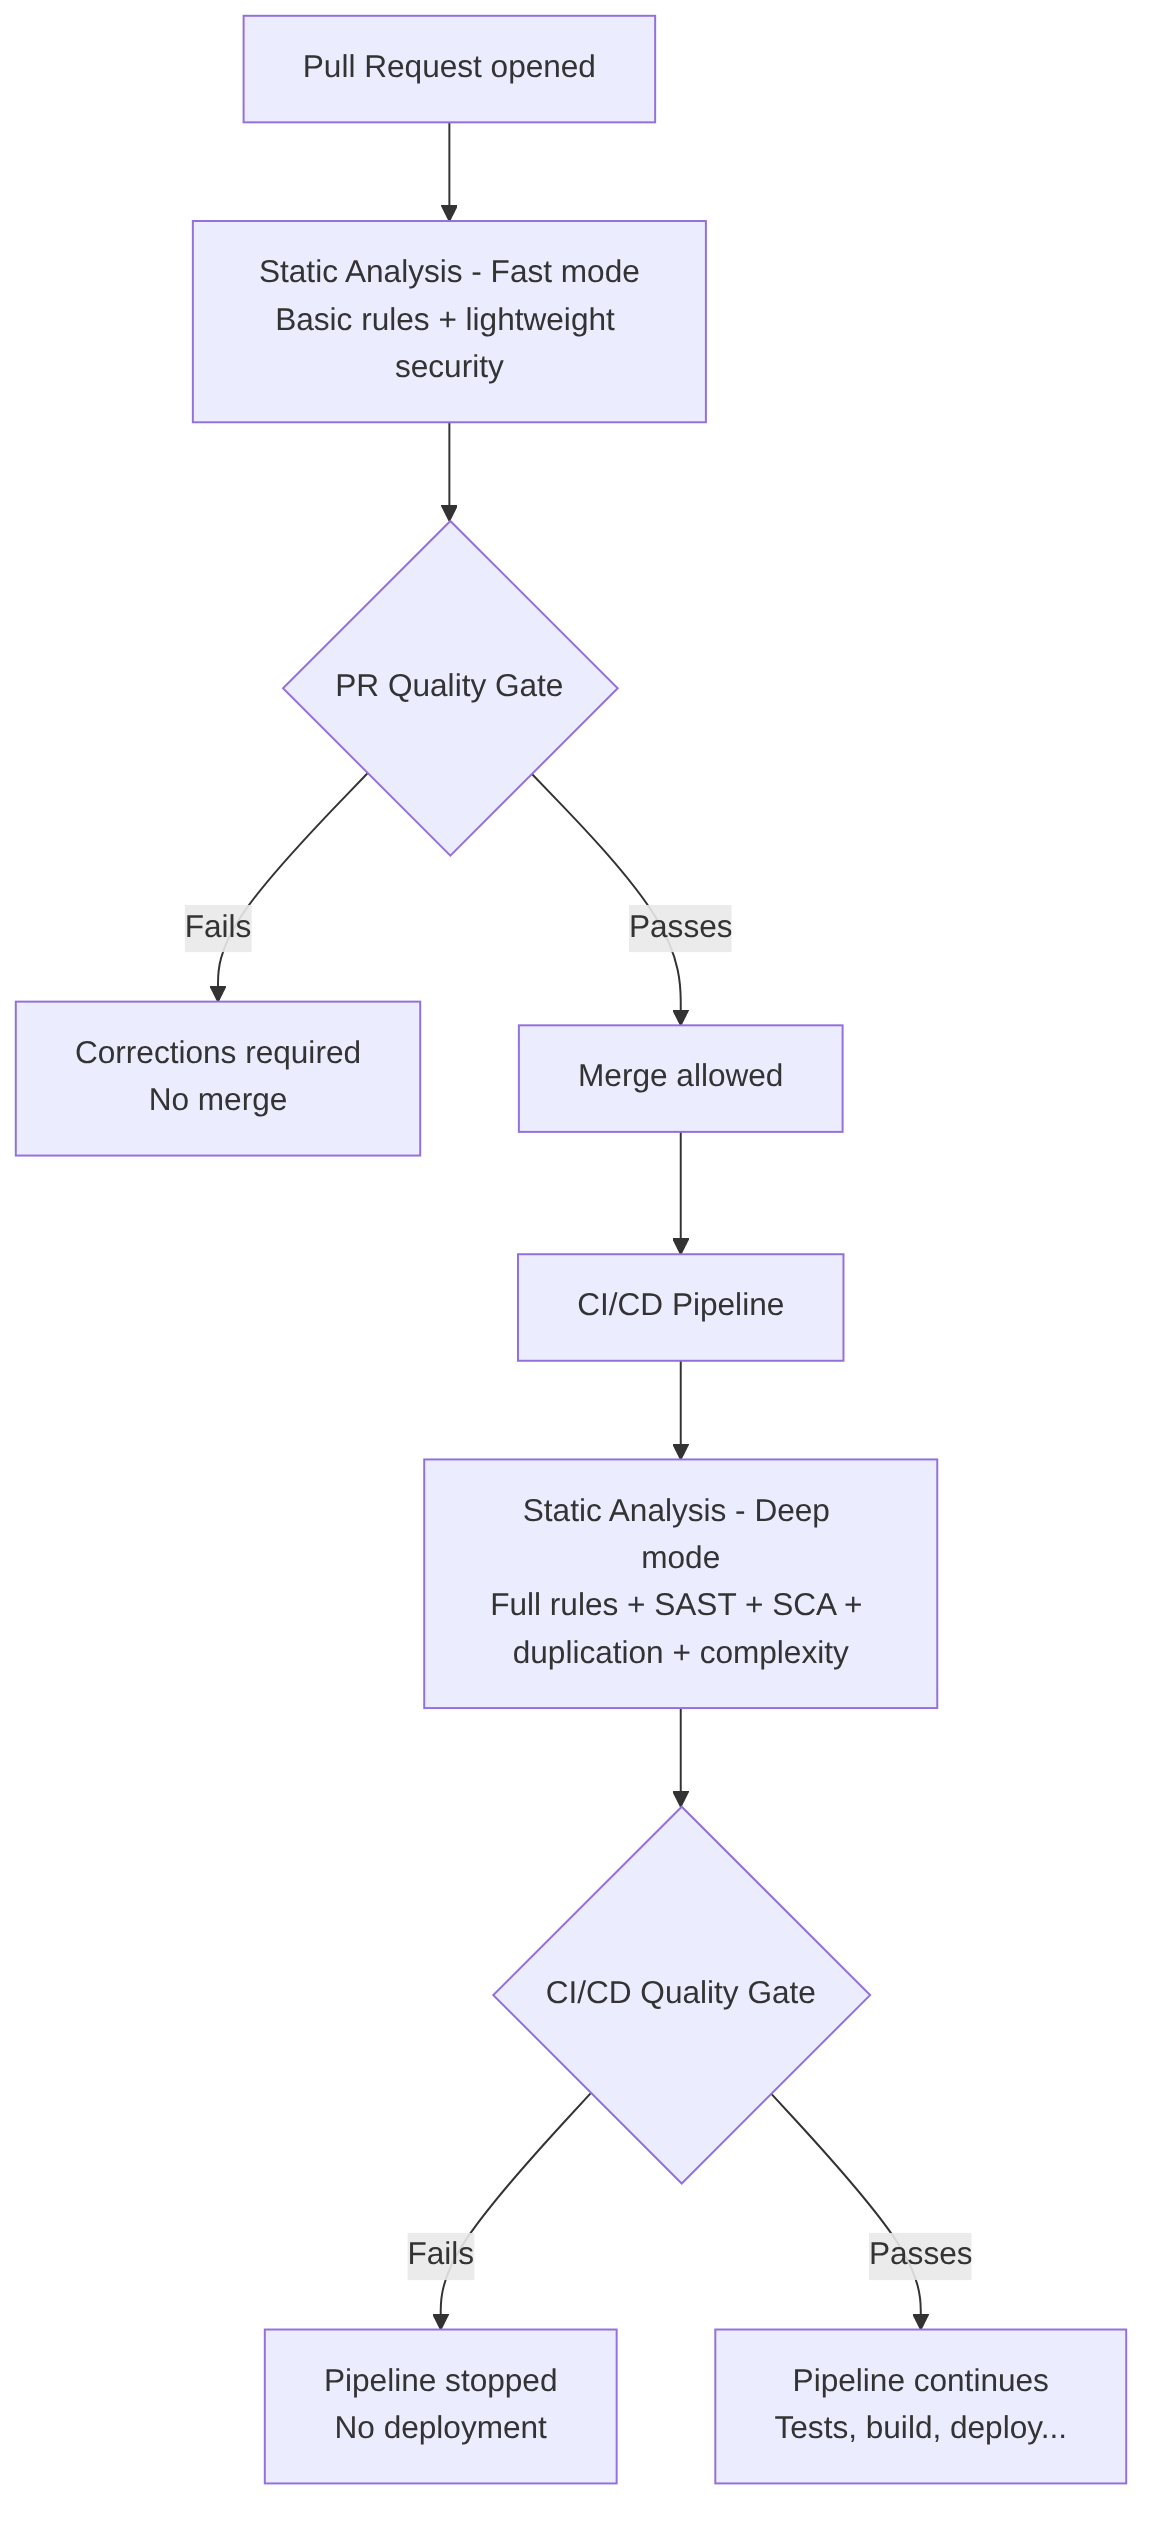
Difference between PR mode and CI (deep) mode
Static Analysis tools
| Type | Tools |
|---|---|
| SAST (security) | SonarQube, Semgrep, Checkmarx, Fortify |
| SCA (dependencies) | Snyk, Dependabot, OWASP Dependency Check |
| Quality | SonarQube, PMD, SpotBugs |
| Architecture | ArchUnit, SonarQube Rules, Semgrep Custom Rules |
AI in this phase
AI complements static analysis, but does not replace it.
Traditional static analysis (SonarQube, Semgrep, Checkmarx…) detects:
- vulnerabilities
- duplication
- complexity
- dangerous patterns
But it does not understand business context or the complete architecture.
AI can:
- explain complex findings
- correlate findings between modules
- suggest refactors
- generate patches
- detect semantic risks
- validate architecture (DDD, hexagonal, CQRS)
- detect inconsistencies between layers
Other areas where AI extends static analysis:
- detects vulnerabilities not covered by traditional rules
- analyzes architecture patterns
- identifies semantic risks
- generates automatic patches
- explains findings in natural language
- correlates findings between modules
- predicts which parts of the code are most fragile
Unit Tests
Goal: Validate the behavior of an isolated unit of code: a class, function, or module.
Characteristics
- They test only the internal logic of a function/method.
- They isolate dependencies through mocks, stubs, or fakes (everything external is mocked: repositories, queues, APIs, services, files).
- They are fast (milliseconds), which is why they are the first tests to run.
- They run on each merge to the main branch (usually after PR).
- They do not require external infrastructure (they must not depend on infrastructure).
- Typical expected coverage: 70–90% (Sonar usually configures 80% by default) depending on the organization.
- They validate: pure logic, control flows, validations, calculations, expected errors.
Goal and when to run it
Before the CI/CD pipeline. Reasons:
- As PR checks (run before merging to main)
- To prevent broken code from reaching the
mainbranch - To give fast feedback to the developer
- To avoid flooding the CI/CD pipeline with trivial failures
- So the human review sees the PR “green”
Continuous Integration (CI). Reasons:
- To generate the coverage report (JaCoCo)
- To feed SonarQube
- To apply the Quality Gate
- To guarantee reproducibility (not relying only on PR checks)
- To make the pipeline deterministic
Java test example with mocks/stubs
Example of Java code (Testing with Spring Boot and Testing Web Layer with Spring Boot) applying a unit test on a service that fetches a task from the database by its ID:
public Task getTask(@PathVariable Long id) {
   // 1. Fetch the task (Optional handles whether it exists or not)
   Optional<Task> taskOptional = repository.findById(id);

   // 2. Check if present
   if (taskOptional.isEmpty()) {
      throw new ResourceNotFoundException("Task with ID " + id + " not found");
   }

   // 3. Extract and return
   Task foundTask = taskOptional.get();
   return foundTask;
}
To test it as a unit test, only the code of the getTask method is tested without leaving it (from the first line to the last). If there are external calls such as to a database, they are mocked (the data returned by the database is faked with when, where we tell it that when findById is called it should return an Optional with a fictitious/mock Task object called mockedTask with invented data):
@Test
void getTask_ShouldReturnTask_WhenIdExists() {
   // GIVEN
   Long taskId = 1L;
   Task mockedTask = new Task();
   mockedTask.setId(taskId);
   mockedTask.setTitle("Existing Task");

   // Simulate the repository finding the task by wrapping it in an Optional
   when(repository.findById(taskId)).thenReturn(Optional.of(mockedTask));

   // WHEN
   Task result = controller.getTask(taskId);

   // THEN
   assertNotNull(result);
   assertEquals(taskId, result.getId());
   assertEquals("Existing Task", result.getTitle());
}
Tools by language
- Java → JUnit, TestNG
- JavaScript/TS → Jest, Mocha, Vitest
- Python → PyTest
- Go →
go test - .NET → xUnit, NUnit
AI in this phase
Unit tests are a good place to use AI, since writing them is tedious and slow, does not offer much complexity, and any minor code change forces rewriting the already-written tests.
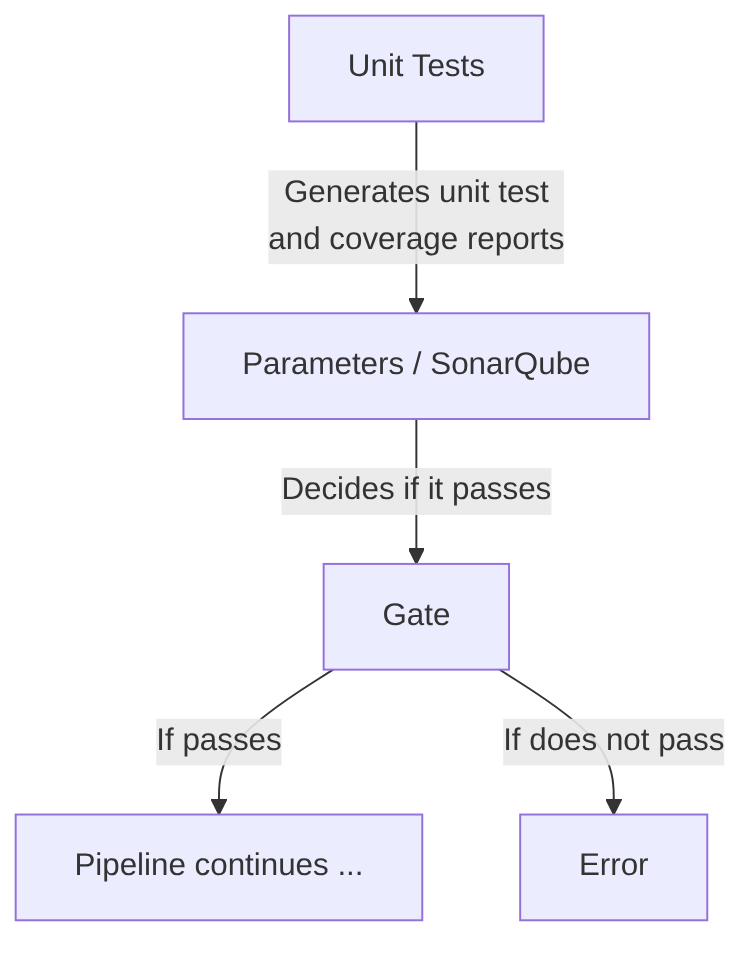
AI-Assisted Gate:
- If coverage < threshold:
- AI analyzes code and coverage
- AI generates missing tests
- AI creates branch
ai/test-fix/<build-id> - AI opens PR with generated tests
- Mandatory human review
- Stage re-execution
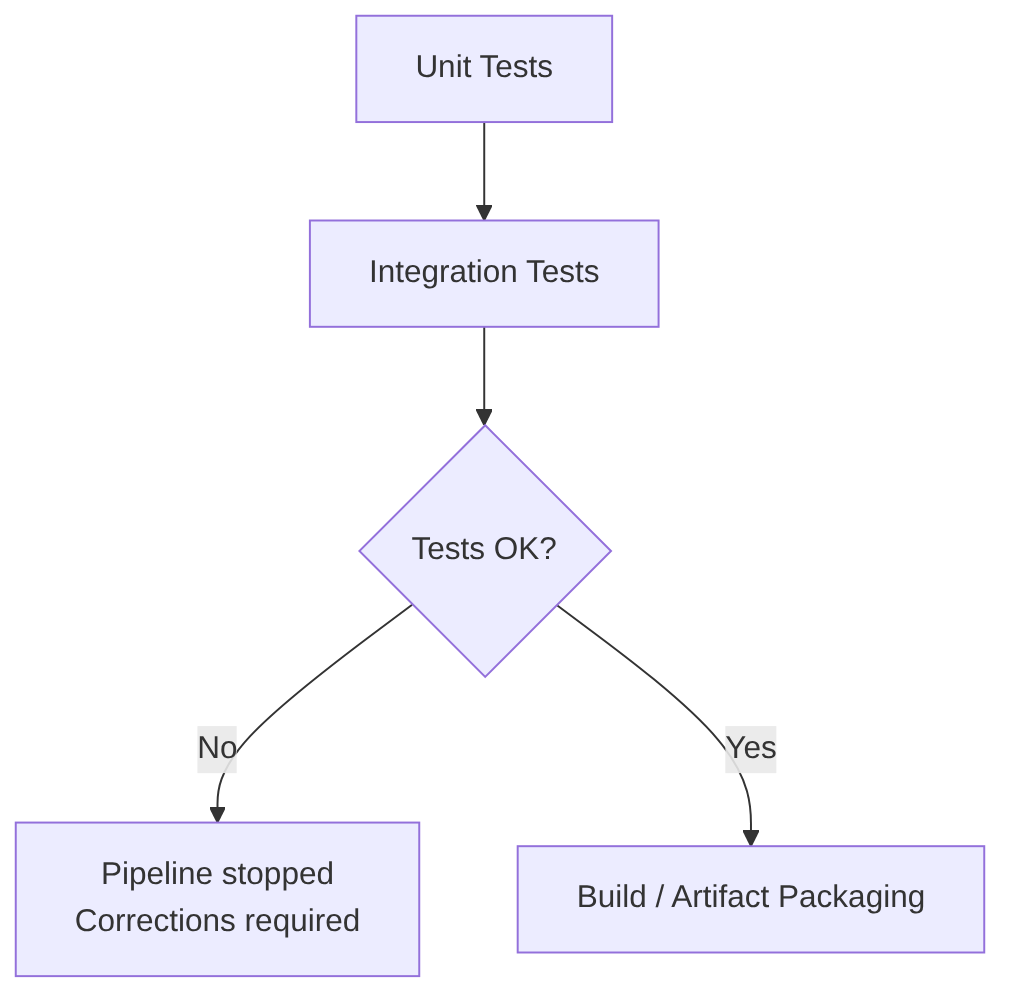
Integration Tests
Integration Tests validate how several components (repositories, services, controllers, configuration, etc.) existing within the same module or service interact. They test the microservice internally end-to-end (for example, a call is made to a controller that calls a service class method that calls a repository), with real test databases and external services (real but for testing).
Note on the word “service”: here “service” is used in two technical senses. “Service” as “an entire microservice” (or “entire application”, as an independent network process) and “service” as “a class” (internally following the Controller-Service-Repository pattern or Domain-Driven Design).
When to run it: after Unit Tests and before packaging.
Integration tests cover:
- interaction between classes
- interaction between internal modules
- interaction with the database (real or testcontainers)
- interaction with repositories
- interaction with internal services of the same microservice
- framework wiring (Spring context, beans, DI)
The 6 strategies for simulating external services
1) Real dedicated test instances (almost obsolete)
Today only used in very specific cases (legacy systems or highly controlled environments). Example: a Postgres “test” database shared by all developers.
Advantages:
- real environment
- same engine as production
Problems:
- constant maintenance
- risk of test interference
- inconsistent state
- hard to reset
- not reproducible
2) Lightweight simulations (H2, SQLite, in-memory, internal mocks)
Useful for fast tests, but not recommended for real integration. Example: using H2 instead of Postgres.
Advantages:
- fast
- no external dependencies
- easy to set up
Problems:
- not the same engine as production
- subtle differences in SQL, indexes, types, transactions
- tests that pass on H2 but fail on Postgres
3) External service mocks (WireMock, MockWebServer, advanced Mockito)
External HTTP services are simulated. Very useful for microservices consuming external APIs. Examples:
Advantages:
- reproducible
- fast
- full control of responses
Problems:
- does not test the real network
- does not test timeouts, latencies, TLS, etc.
4) Manually managed external containers (Docker, Kubernetes)
Better than lightweight simulations, but still imperfect. Example: spinning up a Postgres in Docker or a Kubernetes namespace.
Advantages:
- same engine as production
- more realistic environment
Problems:
- must be maintained
- risk of test interference
- not automatically reset
- require additional infrastructure
5) Testcontainers (modern standard, recommended option)
Testcontainers allows spinning up ephemeral containers, isolated and reproducible for each test or suite.
Example: a Postgres identical to production:
@Container
static PostgreSQLContainer<?> postgres = new PostgreSQLContainer<>("postgres:15");
Advantages:
- same engine as production
- containers isolated per test
- clean state on every execution
- reproducible on any machine
- native integration with some frameworks (such as Spring Boot)
- no external infrastructure required
6) Full ephemeral environments
The entire service (or multiple services) is spun up in a temporary environment. This is already closer to Service Tests or End-to-End Tests, but in some cases is necessary as advanced Integration Tests.
Technologies:
- Kubernetes ephemeral namespaces
- Okteto
- Garden
- Tilt
- Nx Dev Environments
- GitHub Actions + Kind
- GitLab Review Apps
Advantages:
- almost identical environment to production
- more realistic integration tests
- multi-service tests
Problems:
- slower
- more expensive
- more complex
Strategy comparison table
| Strategy | Realism | Isolation | Maintenance | Recommended |
|---|---|---|---|---|
| Shared real instance | ✔ | ❌ | High | ❌ |
| Lightweight simulations (H2 / in-memory) | ❌ | ✔ | Low | ⚠️ Only for fast tests |
| WireMock / MockWebServer | ⚠️ | ✔ | Low | ✔ For external APIs |
| External containers | ✔ | ⚠️ | Medium | ⚠️ |
| Testcontainers | ✔ | ✔ | Very low | ✔ Best option |
| Full ephemeral environments | Very high | ✔ | High | ✔ For advanced teams |
AI in this phase
Does not replace integration tests, but complements them.
AI (does not run tests, only helps write them):
- generates complex mocks
- generates API scenarios
- simulates network failures, latencies, timeouts
- generates realistic data
- detects uncovered dependencies
- generates missing tests
- detects edge cases
- suggests mocks
- explains failures
- generates fixtures
- creates tests with Testcontainers
- suggests simulated infrastructure strategies for tests
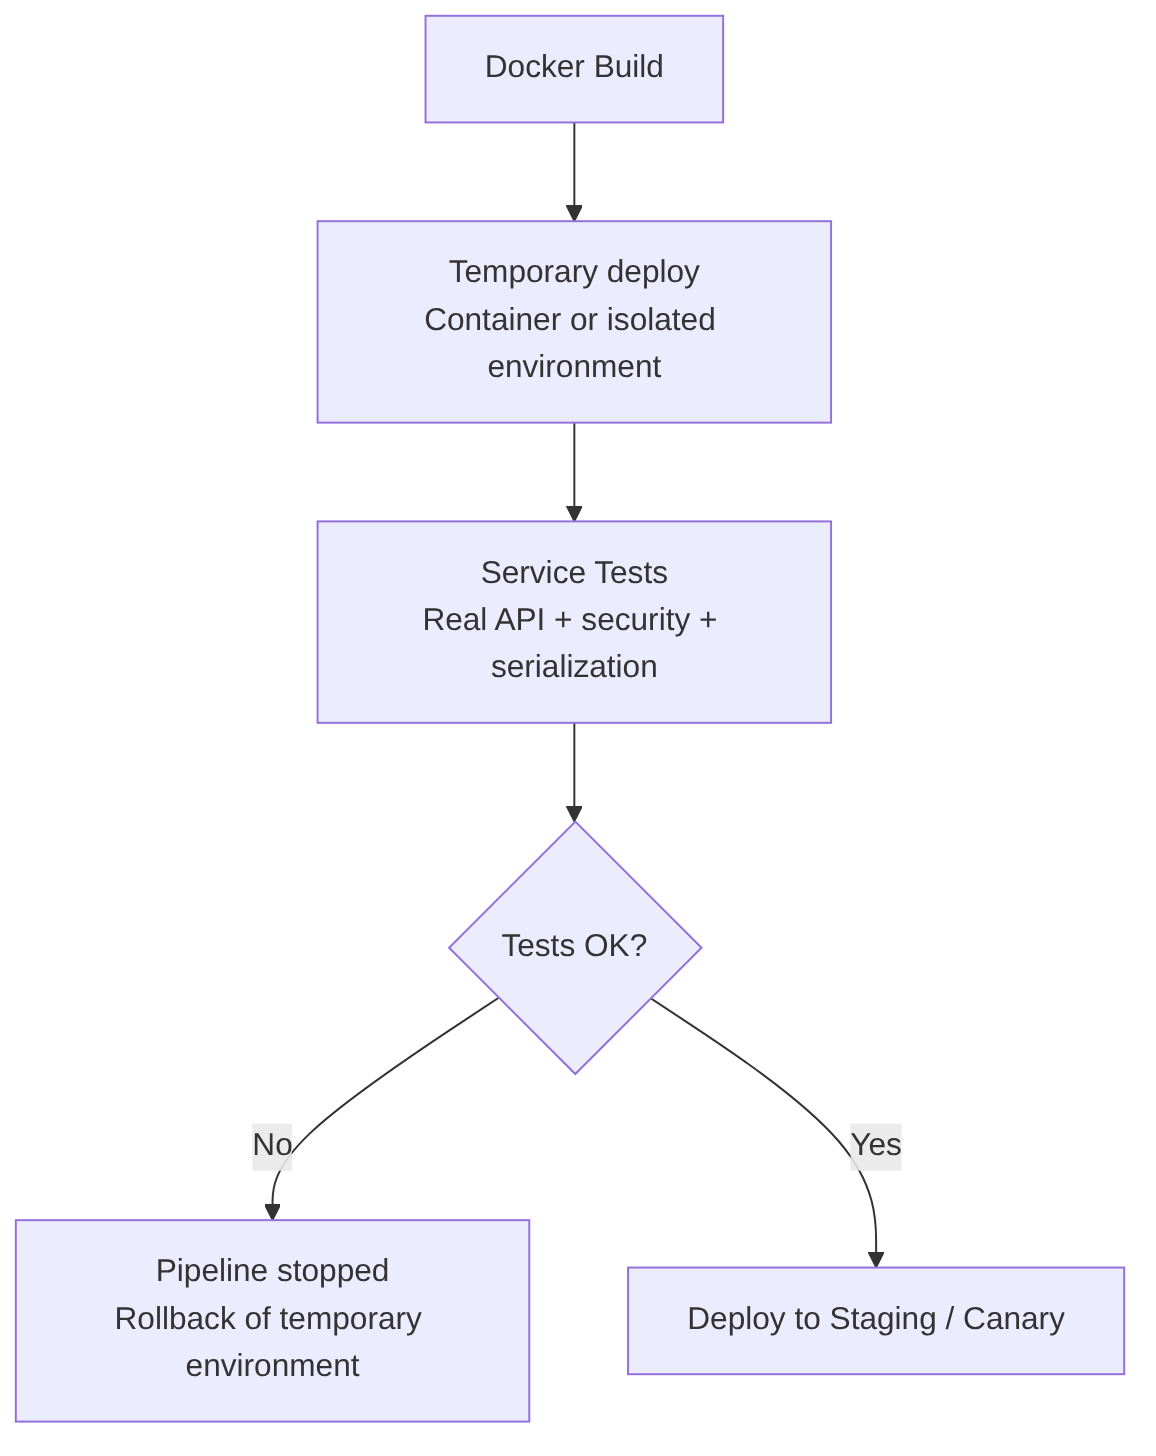
Service Tests / Component Tests
Service Tests test the complete service from the outside, as if you were a real client. They are a “black box” test for a complete application, but isolated from the rest of the world.
Unlike Unit Tests (which test a function) or Integration Tests (which usually test the database connection), a Service Test validates that all the internal machinery of your application (routes, controllers, services, repositories) works correctly against a real request.
When to run it: after generating the Docker image, because you need the service running exactly “as it runs in production”.
What they test
- real REST, HTTP, SOAP endpoints
- validations
- serialization/deserialization
- security (tokens, roles)
- complete service logic
- observable behavior from outside
- integration with simulated dependencies (mocks, wiremock)
What they do NOT test
- internal code details
- interaction between internal classes
- private logic
- internal architecture
Usually tested in:
- temporary environment
- isolated container
- docker-compose
- Kubernetes ephemeral namespace
Contract verification, serialization, and tools
Service tests particularly validate:
- Serialization/deserialization: that the JSON/XML sent and received by the service is correct
- API contracts: that the service responds as it promises (especially useful in microservice architectures)
Main tools:
- RestAssured: Java framework for REST API tests
- Karate: DSL for API tests, combines BDD and functional tests
- Postman / Newman: API test collections executable in CI
- Playwright API: modern API tests with Playwright
Order service diagram example
Example of a service test for an orders microservice:
- spin up the complete service in an isolated environment
- call
/api/orderswith real HTTP - validate response, headers, status codes
- simulate external dependencies (in the example
/stock) with WireMock
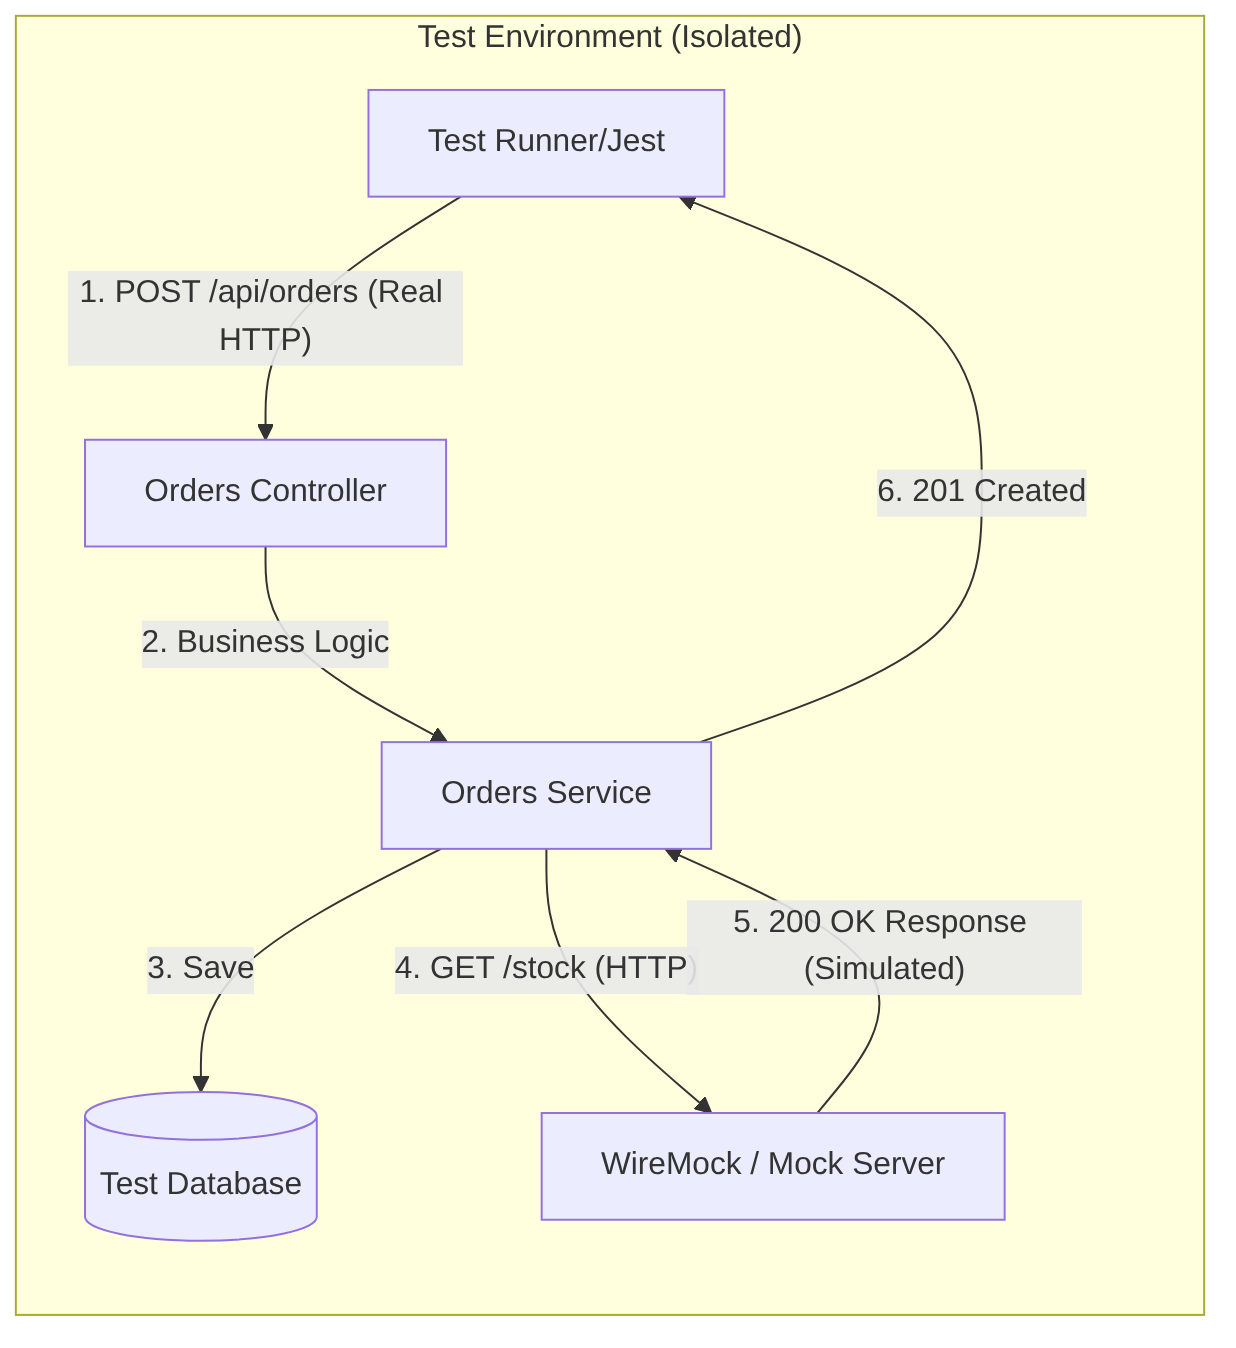
With this:
- You validate the Network: you check that your JSON serializers, authentication Middlewares, and routes are correctly configured
- Total Isolation: if the team maintaining the “Inventory Service” (
/api/orders) has their server down, your tests still pass because you are using WireMock - Confidence: if this test passes, you have 90% certainty that your code will work when deployed, since you have tested it as if you were a real client
AI in this phase
AI is useful for (does not replace real execution):
- generating API scenarios
- creating tests with RestAssured, Karate, Postman, Playwright API
- detecting uncovered routes
- generating mocks of external services
- suggesting security cases (JWT, roles, CSRF)
Coverage (Test Coverage)
The Coverage phase measures what percentage of the code is covered by automated tests. It does not validate whether the tests are good, but which parts of the code are executed during tests.
This stage guarantees:
- that the code has a minimum quality level
- allows the
security scanstage tools such as SAST or risk analysis to prioritize better - avoids analyzing untested code, which is usually an indicator of risk
Advantages:
- Increases code quality
- Reduces regressions
- Allows detecting dead or untested code
- Improves confidence before running security analysis
Disadvantages:
- Does not guarantee that tests are good
- Can slow down the pipeline if tests are heavy
- Can generate “gaming” (trivial tests to boost coverage)
- Requires continuous maintenance
Metrics and coverage diagram flow
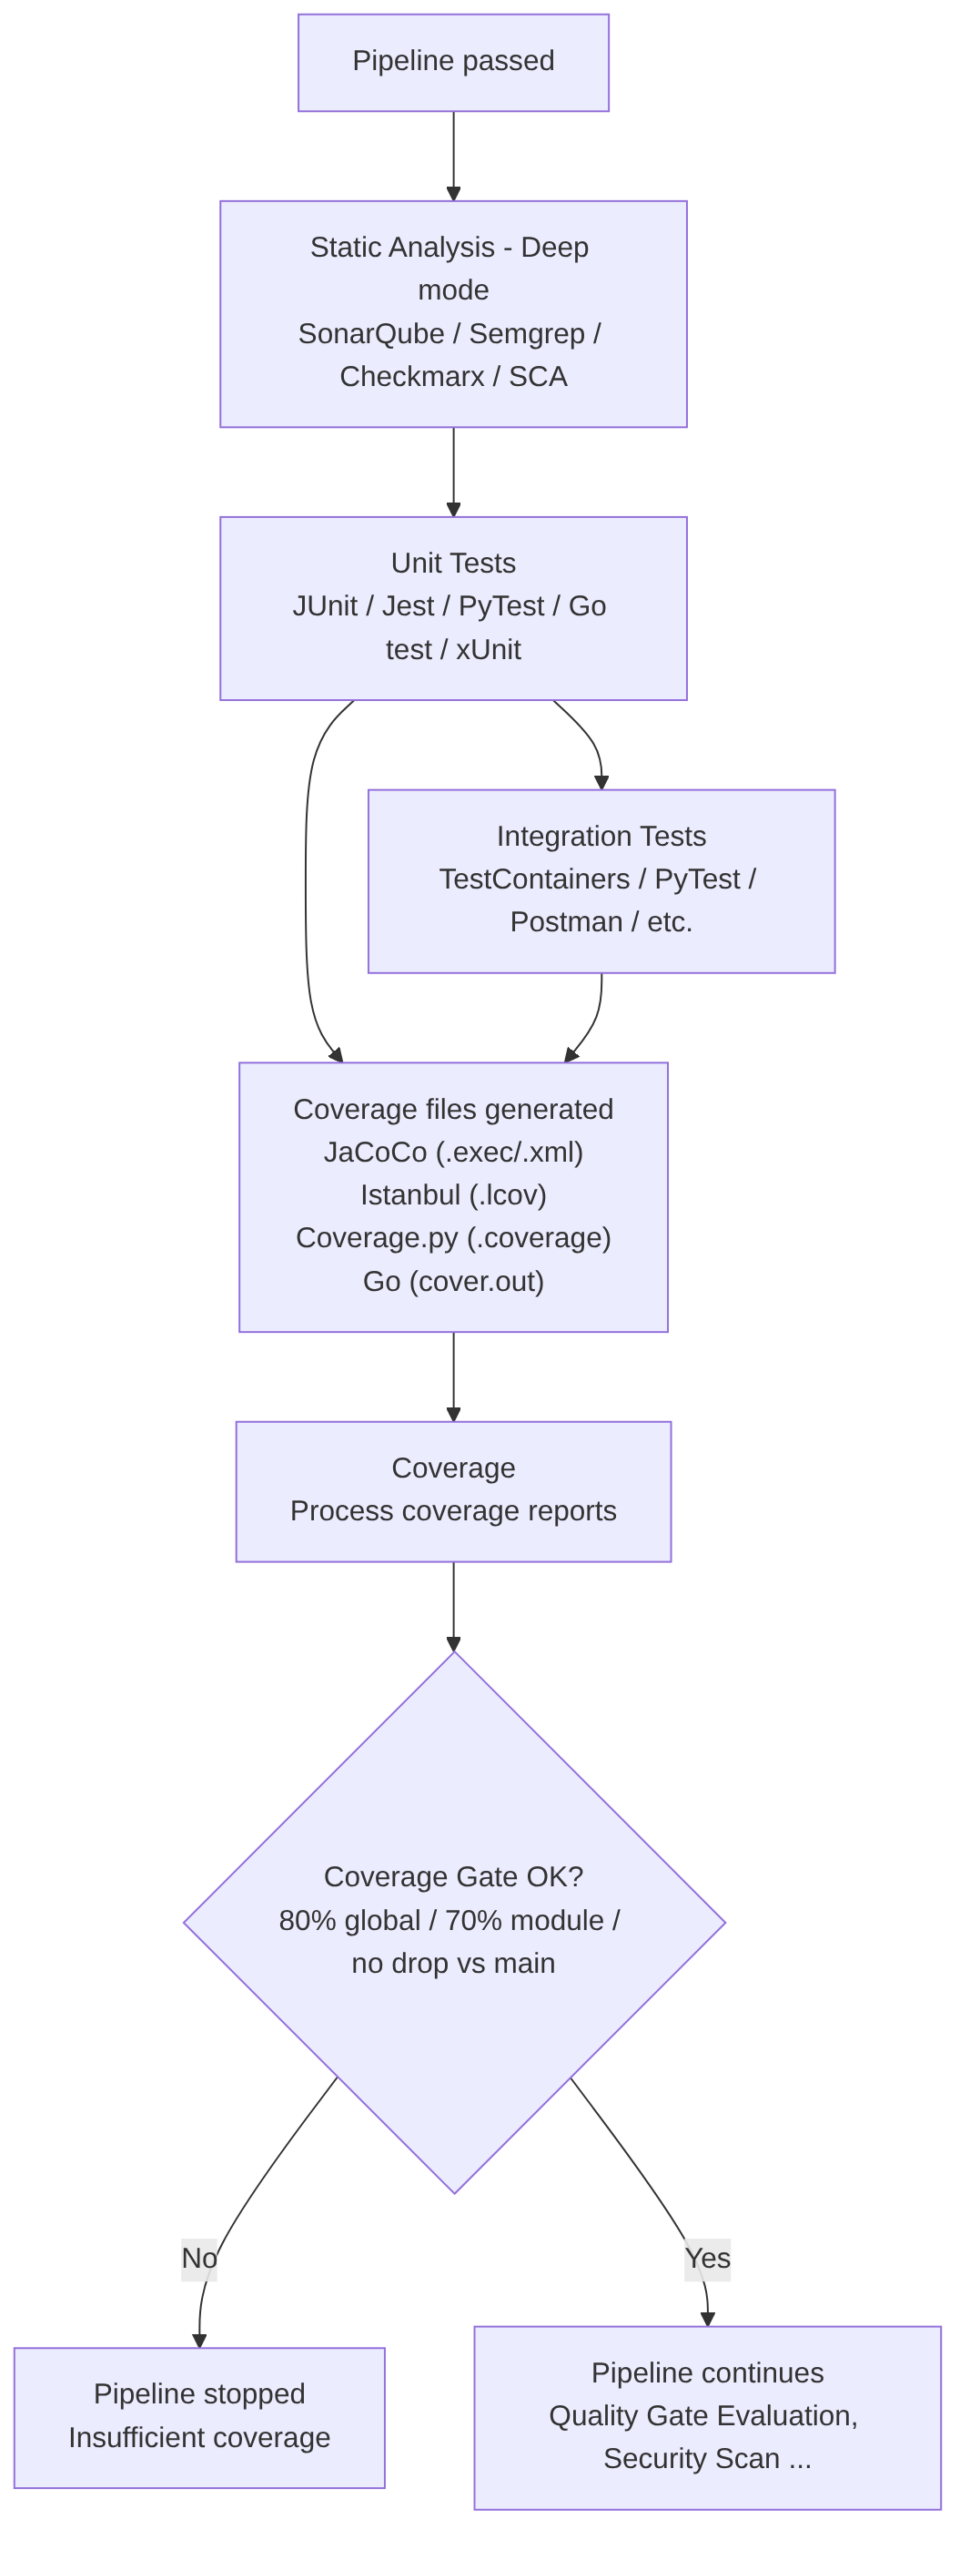
This stage is divided into the following steps:
-
Collect artifacts generated (results) from tests already run in unit tests and integration tests. This step consumes:
- Coverage report files
- Percentages by file/module
- Data to apply the coverage gate (required minimums)
-
Process the coverage files generated by those tests. To process them you can use:
- Java (JaCoCo):
.execor XML - JavaScript or TypeScript (Istanbul/NYC):
.lcov - Python (Coverage.py):
.coverage - Go:
cover.out(cover documentation)
- Java (JaCoCo):
-
Generate the coverage report:
- Global coverage
- Coverage per module
- Coverage per file
- Covered vs uncovered lines
-
Publish the report (for example, display it as a graph on the Jenkins execution page) in formats such as:
- LCOV
- Cobertura XML
- HTML (to display in Jenkins, GitLab, GitHub, Azure DevOps)
-
Apply the coverage gate, for example:
- Minimum 80% global
- Minimum 70% per module
- Do not allow it to drop below
main(compare it) - Decide if the pipeline continues or stops
Tools by language
- Java: JaCoCo (generates
.exec/.xml) - JavaScript / TypeScript: Istanbul/NYC (generates
.lcov) - Python: Coverage.py (generates
.coverage) - Go: native
go test -covertool (generatescover.out)
Coverage gate
Example of a Coverage stage in declarative Jenkins:
stage('Coverage') {
    steps {
        sh './gradlew test jacocoTestReport'
        junit 'build/test-results/test/*.xml'
        publishCoverage adapters: [jacocoAdapter('build/reports/jacoco/test/jacocoTestReport.xml')]
    }
}
AI in this phase
Replaces this stage: NO. Coverage is objective data.
Improves in this stage:
- Automatically generate tests to increase coverage
- Detect critical untested areas
- Suggest edge cases that are missing
- Prioritize tests by risk (sensitive code, security, complex logic)
- Explain why a part of the code should have tests
Reminder of AI usage from previous steps:
- Auto-generate unit tests
- Auto-generate integration tests
- Detect “coverage gaps” in PRs
- Recommend refactors to improve testability
Code Quality Gate
Here all code quality metrics (coverage, bugs, vulnerabilities, duplication, complexity, technical debt) are consolidated and evaluated to determine whether the project meets the standards defined by the organization.
The quick summary of this stage:
- Receives the coverage generated in the previous stage
- Aggregates deep static analysis metrics
- Evaluates the Quality Gate defined by the organization
- Decides if the pipeline can continue
This step aggregates quality metrics such as:
- Coverage
- Bugs
- Vulnerabilities
- Code smells
- Complexity
- Duplication
- Debt ratio
- Maintainability index
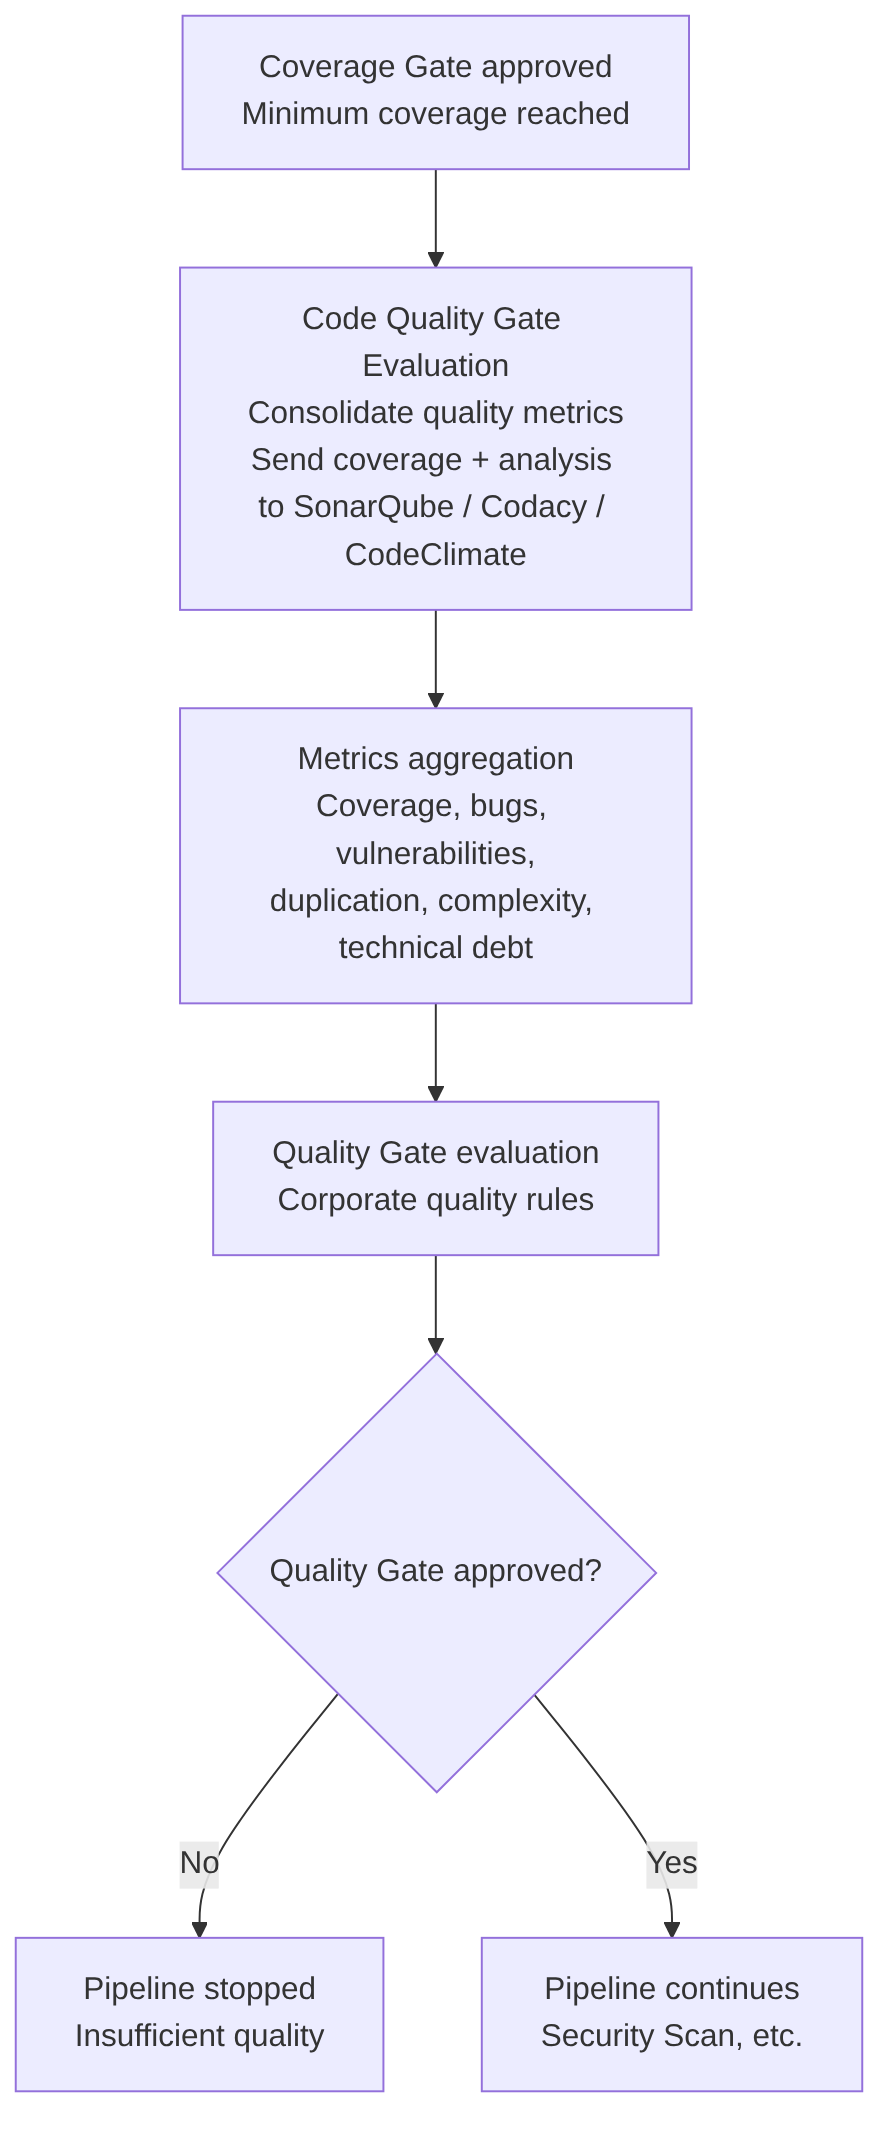
Goal: perform a continuous inspection of source code quality and security, consolidating all metrics generated in previous stages (static analysis, coverage, duplication, complexity, etc.) and evaluating whether the project meets the corporate standards defined in the Quality Gate.
Characteristics:
- Problem detection: identifies errors (bugs), security vulnerabilities, and code smells
- Quality metrics: analyzes complexity, duplication, maintainability, and test coverage
- Security: evaluates risks based on standards such as OWASP Top 10, SANS Top 25, or CWE
- Multi-language: compatible with Java, C#, JavaScript, Python, Go, C++, etc.
- Quality Gate: decides whether the code passes or fails based on corporate rules
- Technical debt reduction: detects improvement points to avoid code degradation
- Automation: integrates into CI/CD for continuous inspection
- Common standards: ensures the entire team follows the same quality and security rules
SonarQube, Codacy, CodeClimate, DeepSource
The most popular tool is SonarQube, though others exist:
- SonarQube / SonarCloud
- Codacy
- CodeClimate
- DeepSource
- Semgrep App
- Fortify SSC
- Checkmarx One
- GitLab Code Quality
- GitHub Advanced Security (CodeQL + coverage)
It serves as a Quality Gate that answers:
- Does it meet the minimums?
- Are there new vulnerabilities?
- Has coverage dropped?
- Is there too much duplication?
Comparison: Coverage Gate vs SonarQube Gate
Does it make sense to have two coverage Quality Gates?
Yes. The differences are that in the previous Coverage Gate step:
- It runs fast
- It runs before sending anything to Sonar
- Avoids “polluting” Sonar with failed builds
- Avoids unnecessary analysis
- It is a fail fast
- Example: “If coverage < 80%, stop the pipeline immediately.”
And this Code Quality Gate Evaluation step that runs after sending coverage to Sonar (it is the final Quality Gate of the complete static analysis) evaluates:
- coverage
- bugs
- vulnerabilities
- code smells
- technical debt
- maintainability
- Example: “Coverage on new code ≥ 90%”, “No new critical vulnerabilities”, “Duplication < 3%”
| Gate | Goal | Moment | Advantage |
|---|---|---|---|
| Coverage Gate (CI) | Fail fast | Before Sonar | Do not waste time |
| SonarQube Gate | Global quality | After sending coverage | Complete analysis |
AI in this phase
Replaces this stage: NO. AI must not invent or simulate this data. It must be objective:
- The real coverage calculation
- Test execution
- Objective verification of covered lines
- Formal Quality Gate evaluation
- Aggregation of static analysis metrics
- Validation of corporate quality rules
These tasks require:
- Real data
- Real execution
- Deterministic metrics
- Business rules
- Audit and traceability
Improves in this stage in the following areas:
-
Automatic test generation to increase coverage:
- Generate missing unit tests
- Detect uncovered paths
- Propose edge cases
- Create integration tests
- Suggest mocks and fixtures
-
Explain why the Coverage Gate fails:
- Analyze which modules have low coverage
- Explain which lines are not covered
- Prioritize which tests are missing
- Suggest refactors to improve testability
-
Improve deep static analysis:
- Detect semantic patterns that rules do not catch
- Correlate findings between modules
- Detect architectural inconsistencies
- Suggest complex refactors
- Generate automatic patches
-
Enrich the Code Quality Gate Evaluation:
- Explain SonarQube findings
- Propose solutions
- Detect false positives
- Prioritize technical debt
- Recommend structural changes
-
Automate pipeline decisions:
- Predict if a PR will break quality
- Suggest changes before running the pipeline
- Detect risk patterns in the code
- Recommend dynamic gates based on criticality
Security Scan
The Security Scan stage is not a single monolithic step, but a set of parallel jobs, each specialized in one type of analysis (usually high-level security, i.e., without executing the code).
This separation allows running the analyses simultaneously, reducing total pipeline time, and applying independent security policies.
Finally, a Security Gate consolidates the results and decides if the pipeline can continue toward the build, test, or deploy phases.
The security jobs may vary. Here we will use the following as examples, which are typically interesting:
- SAST (Static Application Security Testing): analyzes the source code
- SCA (Software Composition Analysis): analyzes dependencies and known vulnerabilities (CVEs)
- Secret Scan: detects exposed credentials
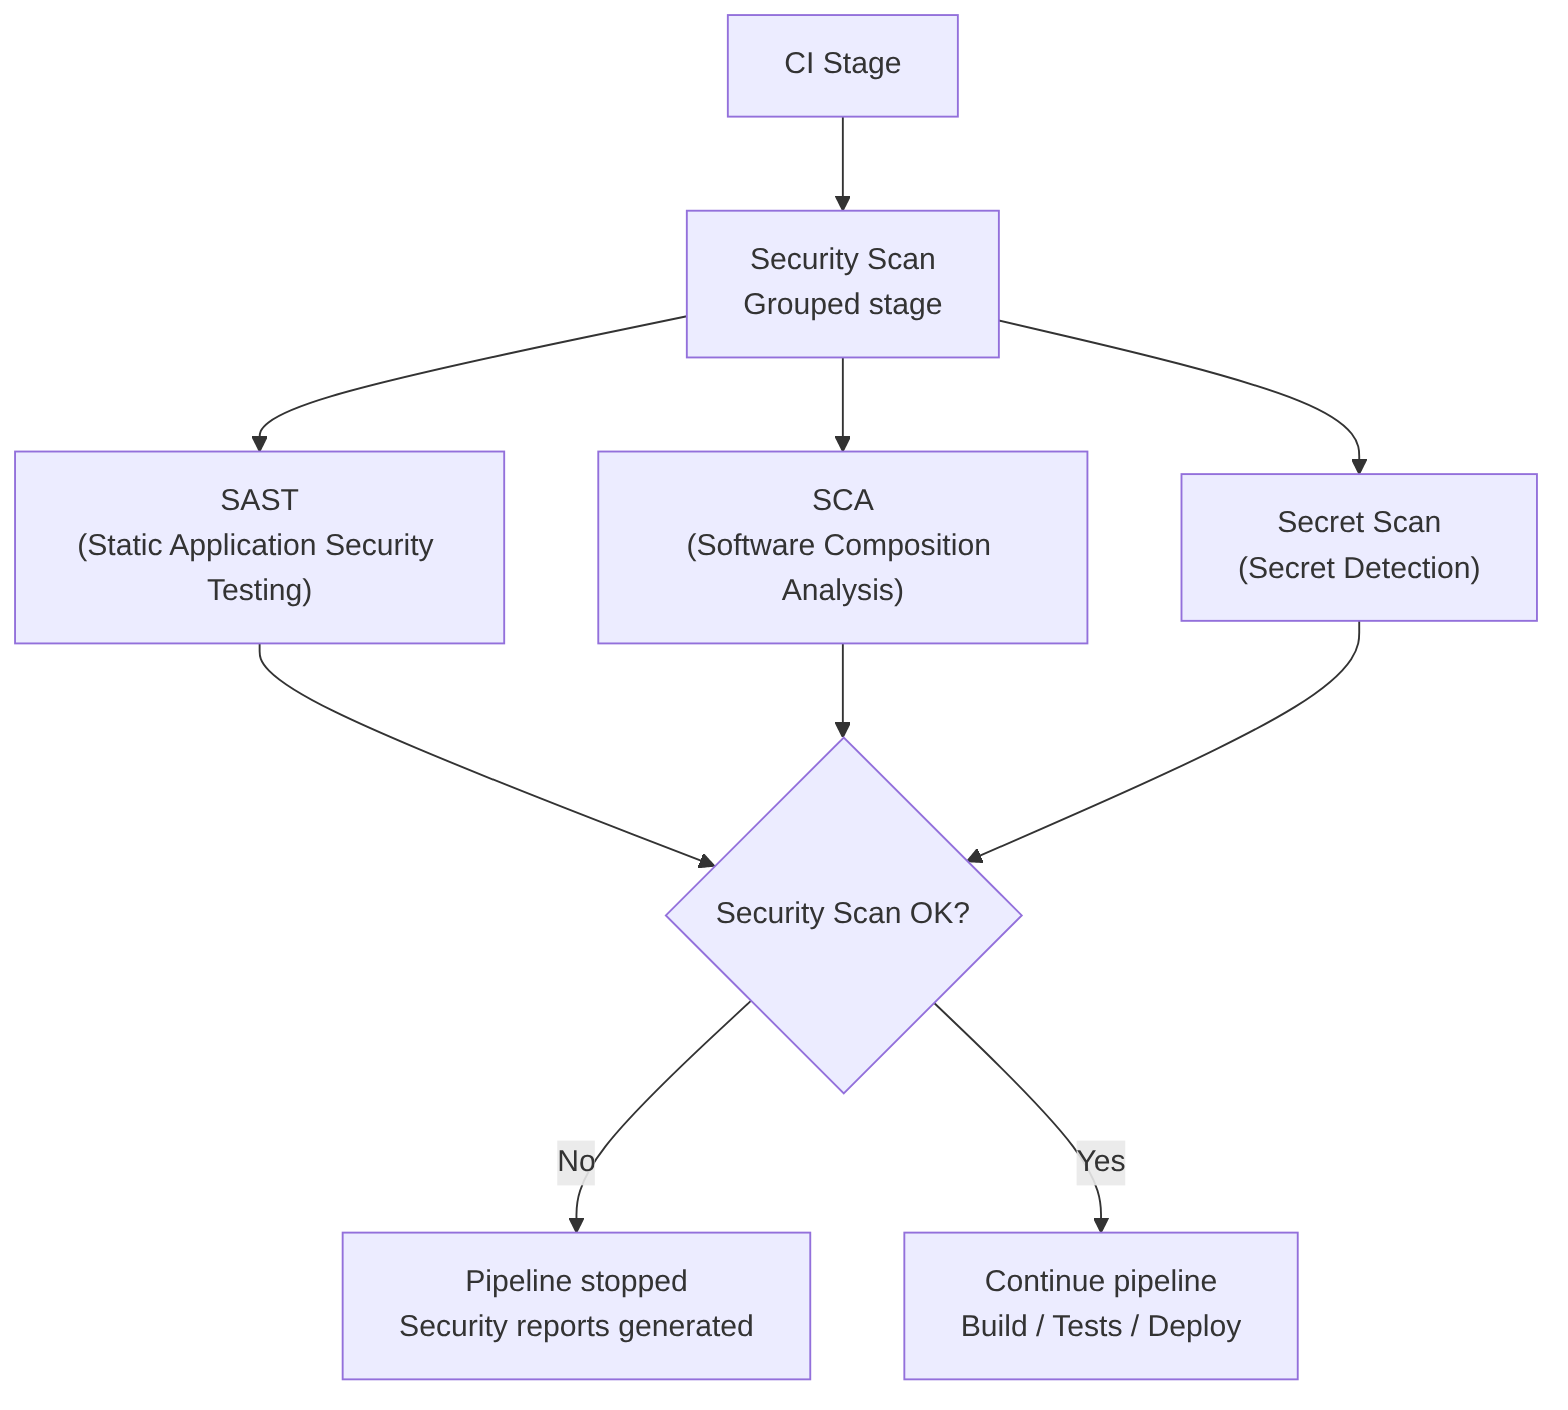
When finished, the gate reviews the job results and applies policies such as:
- If Critical → block
- If High → depends on the policy
- If Medium/Low → allow but log
Example in Jenkins:
stage('Security Scan') {
    parallel {
        stage('SAST') {
            steps {
                sh 'semgrep --config auto'
            }
        }
        stage('SCA') {
            steps {
                sh 'trivy fs --scanners vuln .'
            }
        }
        stage('Secret Scan') {
            steps {
                sh 'gitleaks detect --source .'
            }
        }
    }
}

stage('Security Gate') {
    steps {
        sh './evaluate-security-results.sh'
    }
}
Integrated tools that cover multiple types of analysis:
- Semgrep Platform → SAST + SCA + Secrets + AI.
- DragonSec → SAST + SCA + Secrets + IaC, open‑source.
- Snyk → SCA + containers + IaC + some SAST
- GitLab Ultimate → SAST + SCA + Secrets + IaC
- GitHub Advanced Security → CodeQL + Dependabot + Secret Scanning
SAST (Static Application Security Testing)
SAST analyzes the source code without executing it. It looks for insecure patterns, bad practices, logical vulnerabilities, and incorrect API usage. Its goal is to detect security flaws as early as possible, ideally in the PR.
Advantages:
- Detects vulnerabilities before compiling or deploying
- Integrates easily in PR/MR
- Very useful for typed languages and frameworks with known patterns
- Allows creating corporate policies (custom rules)
Disadvantages:
- Can generate false positives
- Does not detect problems that depend on the runtime environment
- Requires rule maintenance to avoid noise
- In legacy projects can produce a “tsunami” of findings
Example of use in CI/CD:
sast:
  stage: security
  script:
    - semgrep --config auto
  allow_failure: false
SAST Tools:
- Semgrep → Multi-language, customizable rules, AI to reduce false positives
- SonarQube → Java, C#, JS, Python, etc. Very popular in enterprise environments
- Checkmarx → Wide language support, corporate focus
- Fortify Static Code Analyzer → Very complete, targeted at large organizations
- CodeQL (GitHub) → Advanced semantic analysis, very powerful for large repos
- DragonSec → SAST for 20+ languages, open‑source, aligned with OWASP Top 10:2025. Github
- Bandit (Python) → Python-specific
- Brakeman (Ruby on Rails) → Rails-specific
- GolangCI-Lint (Go) → Includes security rules
AI in this phase (SAST)
Cannot replace it, because SAST requires deterministic rules and traceability.
Can improve it:
- Explaining findings in natural language
- Proposing automatic fixes
- Prioritizing vulnerabilities based on code context
- Generating custom rules based on repository patterns
SCA (Software Composition Analysis)
SCA analyzes dependencies, libraries, and packages to detect:
- Known vulnerabilities (CVE, Common Vulnerabilities and Exposures)
- Disallowed licenses
- Insecure versions
It is critical in modern environments where 70–90% of code is “third‑party”.
Advantages:
- Detects real, known vulnerabilities
- Allows license policies (GPL, MIT, Apache…)
- Integrates with PRs to suggest automatic upgrades
- Very fast: analyzes manifests (package.json, pom.xml, etc.)
Disadvantages:
- Depends on the quality of the CVE database
- Can generate noise if there are deep transitive dependencies
- Sometimes suggests upgrades that break compatibility
- Does not detect vulnerabilities in your own code (that is SAST)
Example of use in CI/CD:
sca:
  stage: security
  script:
    - trivy fs --scanners vuln .
  allow_failure: false
SCA Tools:
- Snyk → SCA + containers + IaC
- Trivy → SCA + containers + IaC, widely used in CI/CD
- OWASP Dependency-Check → Open‑source, widely adopted
- GitHub Dependabot → Automatic dependency updates
- Whitesource / Mend → Corporate focus
- Semgrep Supply Chain → SCA with “reachability” analysis (only exploitable CVEs). Semgrep
AI in this phase (SCA)
Cannot replace it, because SCA depends on official CVE databases.
Can improve it:
- Prioritizing vulnerabilities by real impact in your code
- Explaining whether a CVE actually affects your usage of the package
- Proposing automatic migrations to secure versions
- Detecting unused dependencies (dead dependencies)
Secret Scanning
Searches for exposed credentials in the repository:
- API keys
- OAuth tokens
- Passwords
- Certificates
- Private keys
Its goal is to prevent leaks and unauthorized access.
Advantages:
- Detects secrets before they reach main
- Very fast and easy to integrate
- Compatible with PR/MR and individual commits
- Prevents critical security incidents
Disadvantages:
- Can detect false positives (e.g., strings that look like keys)
- Does not prevent a developer from pushing an incorrectly encrypted secret
- Does not protect secrets at runtime (only in the repository)
- Requires rotation policies if a leak is detected
Example of use in CI/CD:
secret_scan:
  stage: security
  script:
    - gitleaks detect --source .
  allow_failure: false
Secret Scanning Tools:
- Gitleaks → Very fast, open‑source, de facto standard
- TruffleHog → Deep scanning, even through Git history
- GitHub Secret Scanning → Integrated into GitHub
- GitLab Secret Detection → Integrated into GitLab
- Semgrep Secrets → AI + semantic analysis to reduce false positives. Semgrep
- DragonSec Leaks → 50+ secret patterns (AWS, GCP, GitHub, SSH…). Github
AI in this phase (Secret Scanning)
Cannot replace it, because detection requires cryptographic patterns and specific heuristics.
Can improve it:
- Classifying whether a secret is real or a false positive
- Automatically proposing secret rotation
- Suggesting how to refactor the code to avoid hardcoding
- Detecting risk patterns (e.g., “this module tends to contain keys”)
[You can continue to next article: CD (Continuous Delivery) — Part 1: packaging, SBOM, and remediation](https://jarroba.com/en/ci-continuous-integration-analysis-tests-quality-and-security/)
