

Analyzing Soccer Results with Power BI
Business Intelligence turns data into information and information into knowledge for business decisions. See it in action analyzing Spanish soccer results with Power BI.
Code
Inside articles there are more settings: width, font size, series position and code.
Saved in this browser.
Business Intelligence turns data into information and information into knowledge for business decisions. See it in action analyzing Spanish soccer results with Power BI.
One of the problems when applying a Clustering method (K-means or EM) is choosing the number of Clusters. Learn the elbow method, dendrograms and the gap.
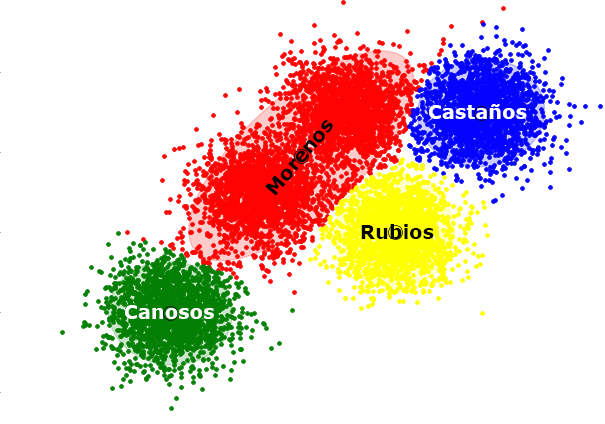
Expectation-maximization is a statistical clustering method similar to K-means, but with a probabilistic approach. Learn how it works with Python examples.
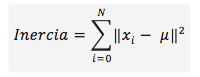
K-means is a clustering method that splits objects into K groups by minimizing inertia. Learn how it works and how to use it in Python with scikit-learn.
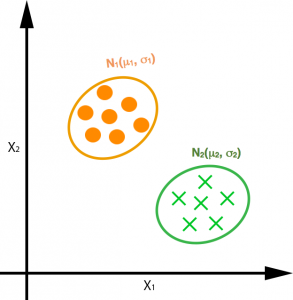
Clustering is the task of grouping a set of unlabeled objects into subsets of objects called Clusters. Learn how it differs from classification.
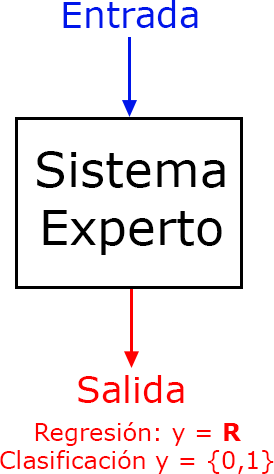
Machine Learning (ML) is a branch of Artificial Intelligence (AI) that aims to build systems able to learn on their own from a data set, without explicit programming.
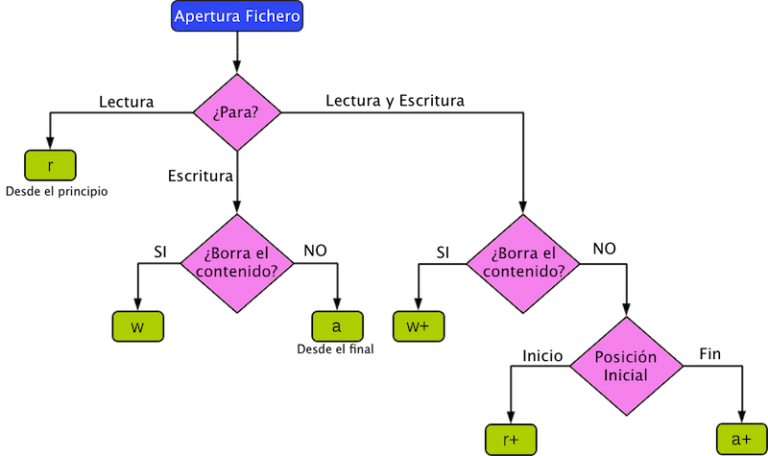
In this tutorial you'll learn how to read and write files in Python, one of the most useful and commonly used tasks when programming. Examples included.


Learn the Singleton design pattern in Java: a software engineering pattern that limits the creation of objects of a class to one, with code examples.
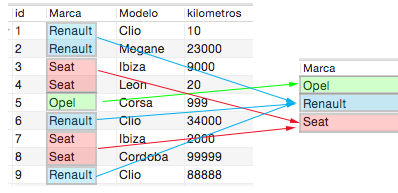
The "Group By" statement groups identical values in a table. Learn how it works with COUNT, SUM, MAX and MIN in this video tutorial and step-by-step examples.


Pandas is a Python library for data analysis that provides flexible data structures that let you work with your data very efficiently. Start here.
In this tutorial we show some of the operations and features the Pandas library offers for working with DataFrames, including I/O, merge and groupby.
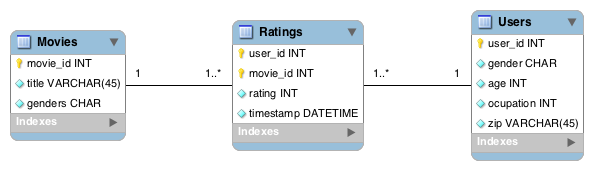
Learn how to use pandas pivot_table in Python with practical examples: group, aggregate and analyze the MovieLens dataset like in a spreadsheet.